


Raoul Pal Gave a Stock Market Indicator Very Few Are Paying Attention To.
It’s the lead signal for price action that has laser-sharp accuracy.

Raoul Pal is my go-to safety signal.
The quintessential Brit retired at 36 and now lives it up in the Cayman Islands, snorkelling, sipping wine, and breaking down global markets on his YouTube channel like you’re one of his buddies on the couch.
It’s like a tutorial for kindergartners, and by the end of it, you’re scribbling economic equations on your grandma’s windowpane. Lol.
He combines fundamental and technical analysis with understanding the business cycle and says, If you can’t say your investment thesis in one sentence, it’s already too complicated and — “If you can’t explain it to your mate in the pub, you won’t make money.”
In 2008, interest rates went to zero, governments had a debt jubilee, it was an election cycle where Obama beat McCain, and politicians gave out stimulus like candy to voters.
Pal says these events mirror each other approximately every four years in a cycle he calls “The Everything Code.”
Understanding this gives you a framework for investing that’ll help you time markets and “squeeze the juice from a trade.”
The man with over 30 years of experience as a former Goldman Sachs bond trader says Technology stocks will outperform, but — “Everybody is wrong about this market — I don’t see how you can have 2008 again once you have the money printer.”
He believes everything is driven by liquidity, saying, “Once liquidity changes, everything changes.”
There’s one key indicator that tells you when.
Extract maximum value with this framework.
Using a business cycle framework to map out a time horizon had never crossed my mind.
It was a lightbulb moment once I realised that tech stocks respond to liquidity events and that the M2 money supply (measure for money in circulation) mirrors the Nasdaq and S&P500.
Cathie Wood of Ark Invest says that although the stock market has shown an overall recovery, it’s narrowing. We’re heading toward an icy cliff because growth comes from only a small fraction of stocks.
She says it’s mostly down to the “excitement” around AI.
Cathie Wood — Source
“The economy will have a harder landing than most expect. The equity market has narrowed to just a few stocks, with mega-cap tech stocks accounting for 75 % of the market’s move.
Narrowing tends to be very negative if sustained. It means we’re setting up for a bear market and will have a harder landing than most expect.
It’ll be uncomfortable enough for companies that are losing pricing power and experiencing margin pressure and will force them to adopt these new technologies faster than otherwise would be the case”.
Raoul Pal disagrees and says the basket of tech stocks can’t crash because of “future anticipated liquidity”, its stimulative effect on asset prices, and one data point with laser-sharp accuracy.
The ISM.
Everyone raves about the ISM survey — from Jerome Powell and the Fed to macro traders. But it wasn’t until recently that it caught my attention.
The ISM (Institute of Supply Management) is a sentiment survey that polls over 50,000 executives responsible for their company’s supply chains across 400 US manufacturing firms. The executives are asked about activity levels in areas such as employment, new orders, production, inventories, stock prices, backlog orders, and imports.
The survey signals the productivity these companies think will happen. The information is collected monthly and put into one ISM index, which is regarded as the most reliable source for predicting the U.S. and global economies.
Motley Fool calculated:
“Between the beginning of 1948 and January 2023, the ISM Index fell below 43.5 on 14 occasions. Except for a steep decline in the early 1950s, a drop below 43.5 has signalled a U.S. recession every single time for seven decades.”
It’s as precise as a surgeon’s scalpel and has been spot-on for 70 years. An ISM score of anything below 50 suggests we are in a period of contraction and can be the lead indicator of an upcoming recession.
On the upside, the economy grows when it goes above 50, and anything above 60 booms.
As macro investor Raoul Pal says:
“What you don’t want to do is look at where the ISM is today. The secret is the ISM goes up and down in a cycle — when it goes down, it usually goes all the way down into a recession, and when it goes up, it goes up to a boom — once you know that, you know how to invest, and I find the ISM the single most important indicator”.
Here’s where we are now with a score of 48.1 — but it appears to have bottomed, which is why the Stock Market has rallied.

It’s your 22-month headstart.
Once I realised that using the ISM is your starting point, I had a huge advantage in predicting what would happen.
When the survey shows stability or an uptick in manufacturing, it sets off a chain reaction, boosting corporate profits, which is great news for the stock market.
When people profit from the stock market, their risk appetite improves, and you see a rotation out into growth stocks, which dominate 30% of the stock market.
Pal says it’s all driven by liquidity in the system, and the ISM is the leading indicator. Despite the stock market performance, he says, “By every indicator, we’re in a recession already.”
He’s referring to the ISM remaining under a score of 50 for back-to-back periods, which signals a period of contraction for manufacturers.
So, the ISM has bottomed, the Fed’s rate-hiking cycle is over, and attention is turning to interest rates coming down to service debt.
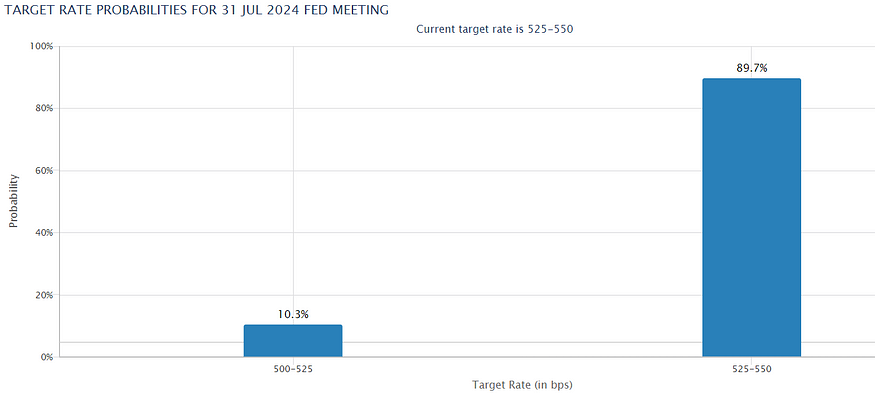
According to the CME’s FedWatch tool, interest rate traders predict a 10.3% chance that Jerome Powell will reduce interest rates and an 89.7% chance of staying the same.
Money printing will be necessary to service the debt because America already has 124.6% of GDP, meaning the U.S. borrows more than it creates in productivity.
When the money printer kicks into gear, it rockets asset prices into overdrive.
Interest rates could likely be significantly lower than 5.5% because there’s a $34 trillion national debt to service. They’d be paying $1.8 trillion a year in interest alone, so it almost has to come down.
Ray Dalio, the world’s best fund manager, says, “Central banks will be forced to print more money and buy more debt as they experience losses and deteriorating balance sheets.”
It’s eroding purchasing power but juicing up assets like they’re on steroids.
The domino effect of liquidity increases Stock prices.
I hear people often speak about a recession hurting Stock prices, but it doesn’t seem to be happening.
The chart below shows the S&P500 mirroring the ISM data since 2011, with an outlier of the global pandemic in 2020. More recently, the market appears to price in the ISM bottoming with a rally (shown as the red arrow).
Raoul Pal — Source
“The fact that Stock prices have a lead over ISM is being driven by the turn higher in the liquidity cycle, which bottomed last year and continues to rise year-on-year. This is why we have seen such a face-ripping rally in tech stocks year-to-date — it’s all down to a turn higher in liquidity.”

Final Thoughts.
This is a lead signal that very few are paying attention to because if they were, I think they’d be less bearish.
I believe Pal is spot-on with his thesis: Numerous signals point to future liquidity events that will drive up asset prices.
According to the ISM, we’re either on the edge of a recession or already in one. But that hasn’t fazed tech prices, which have already anticipated and factored in the downturn.
It’s a stock market indicator people should pay attention to.