

You Keep Losing Money in Crypto Because You're Not Using an ISM Framework.
You Keep Losing Money in Crypto Because You're Not Using an ISM Framework.
It's a lot simpler than you think.


Making the same damn mistakes was a loop I was stuck in.
I was the chief speculator who made financial decisions based on second-hand information and zero data — diving in headfirst armed with emotion and a clickbait media headline.
My excitement would turn to that heart-sinking, stomach-churning feeling of watching my entire portfolio plummet by 80% like a broken elevator.
Then come hell or high swamp water, clenching my teeth like a semi-murderous psychopath I'd refused to sell.
Thankfully, I never caved. But boy, it was stressful.
If only I knew there was actually a method to all this madness and not the kind, I was engaged in, which was acting like a drunken sailor at a roulette wheel.
A framework exists that helps you understand where we are directionally and how to squeeze every ounce of juice from a crypto trade.
The framework doesn't predict price movements but provides a highly accurate indication of whether the price will likely go up or down in a 22-month window.
It's what Macro investors call an "ISM Framework".
It sounds more complicated than it is, but I'm sure that once you understand it, you'll hopefully have the same epiphany I did — the aha Eureka moment.
Buckle up, and let's dive into it.
It's how you navigate in the dark.
Macro investors will tell you that liquidity drives the entire Crypto and Financial market.
It's obvious.
If Crypto markets anticipate a period of quantitative tightening, prices will tank. If signs on the horizon indicate that stimulus is set to pour in regardless of a recession—it'll kick off a buying spree.
As money enters the system at the start of a new cycle, it slowly rotates into alternative assets as people's risk appetite for investing improves.
The ISM is a laser-sharp data point and ground zero for anticipating productivity. This has a knock-on effect on corporate profits, which in turn impacts Crypto prices.
Now, don't scan read this part, really get into the meat and potatoes.
I consume a metric ton of Crypto content from every corner of the internet. I constantly hear people quoting the ISM survey and wonder what they’re talking about—from Jerome Powell and people at the Fed to macro traders.
It wasn't until recently that I started paying attention.
The ISM is a sentiment survey in which 50,000+ executives in charge of their company's supply chains are asked what they think the activity level is for things like employment, new orders, production, inventories, stock prices, backlog orders, and imports.
It covers 400 US manufacturing companies and signals the productivity these companies think will happen.
The ISM index, collected monthly, is considered the most reliable source for predicting the U.S. and global economy.
Motley Fool calculated, “Between the beginning of 1948 and January 2023, the ISM Index fell below 43.5 on 14 occasions. Except for a steep decline in the early 1950s, a drop below 43.5 has signalled a U.S. recession every single time for seven decades.”
It's as precise as a surgeon's scalpel and hasn't been wrong in 70 years.
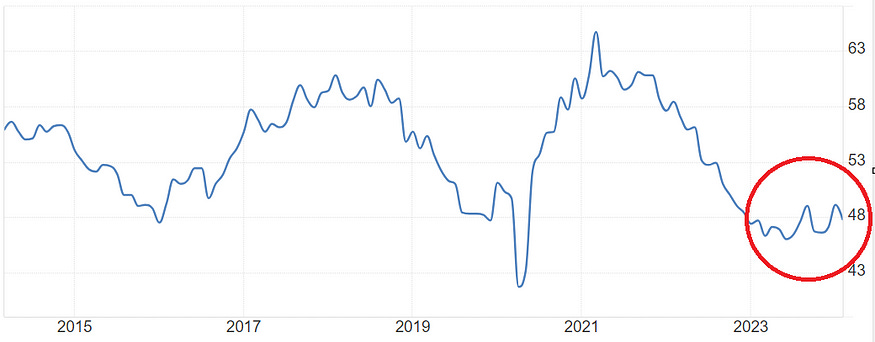
An ISM score of anything below 50 suggests we are in a period of contraction and can signal an upcoming recession.
On the upside, the economy grows when the score is above 50, and anything above 60 means we're in boom territory.
Macro investor Raoul Pal says:
“What you don’t want to do is look at where the ISM is today. The secret is the ISM goes up and down in a cycle — when it goes down, it usually goes all the way down into a recession, and when it goes up, it goes up to a boom — once you know that, you know how to invest, and I find the ISM the single most important indicator”.
Here's where we are now with a score of 47 — but it appears to have bottomed, which is why the Crypto market has rallied.
Final Thoughts.
This framework gives you a lead over what will happen with the economy and asset prices.
There's substantially less guesswork.
Now that I know the ISM has bottomed, I look at other indicators for safety signals. The Fed has signalled that interest rates are coming down soon.
That's a giant tick in favour of more liquidity.
It might not feel like it when you're doing your weekly shopping, but inflation is getting crushed from a high of 9.06% to 3.15%.
The U.S. is due to refinance its debt, but because it is at 122% of GDP, we have to turn on the money printer to service the debt, which will have an ongoing stimulative effect on asset prices.
Then, to put the cherry on top of the cake, the Bitcoin halving is right around the corner, reducing the supply of the largest cryptocurrency.
Prices during the last three halving events have gone up by at least a factor of 10.
Halving one:
Price at time of halving: $13
Following year's peak: $1,152
Halving two:
Price at time of halving: $664
Following year's peak: $17,760
Halving three:
Price at time of halving: $9,734
Following year's peak: $67,549
I can comfortably ignore conversations mostly from ‘no-coiners’ who say that Bitcoin and Crypto are market bubbles due to crash. It's because I'm armed with this framework and data behind me.
That's not to say we won't see temporary or aggressive drawdowns, but it gives me the air cover and confidence to make larger concentrated bets.
It's a framework worth paying attention to.
Hey Jayden.
Thank you so much for this article.
So much value in it!!!
And you put it so simple, which is awesome!
As Einstein said: if you can't explain something in a simple comprehensive way, you haven't understood it.
Thank you.
Big hug.
🙏🏻🍀